
This collaborative post, based on Alice Twaite’s research, is Part Two of our work on adoption targets.
[Update : You will now find the press release issued on publication and links those responses to this post which we are aware of at the foot of this post.]
Part One explored how councils are performance managed at a national level in relation to numbers of children adopted from care: “It’s wrong to measure the success of local authorities in terms of adoption numbers”.
A series of previous blog posts trace the origins of our interest in this topic. We have listed them at the end of this document.
In particular we were responding to concerns expressed by the former MP John Hemming who noted that children were leaving care and being adopted at a much higher rate in the UK than in any other European country. He posed an important question:
“We do need to ask how much of an effect adoption targets are having on the numbers of adoptions, if they are not to prevent children who would previously have returned to their parents from doing so.”
Our first attempt to provide some clarity on this issue showed us that we needed much fuller information from a wider range of sources. We agreed with Mr Hemming that this was an important issue and we wanted to establish the facts, if we could. We had often heard assertions that some individual councils used targets but we hadn’t seen evidence to confirm or deny this. We continued to have major concerns about potentially dangerous or misleading information given to families, which could be given on the basis that their children would be ‘taken’ in order to meet such targets.
We therefore made requests under the Freedom of Information Act to English and Welsh councils. The results of our first request informed Part One (link above). The results of our second request are in this blog.
It has taken us much longer than we expected to complete this piece of work. Even now, the information we have gathered and analysed over many (unpaid) hours raises perhaps more questions than answers. It is a matter of some concern to us that it was so difficult to get a simple answer to our questions about this important topic, and the lack of transparency on this issue cannot assist in the development and understanding of policy.
It is also a concern that the responses of some councils do not lessen the concern expressed by Mr Hemming and others about the potential for ‘targets’ at one end of the process to have an impact on decision making at the very beginning. The original intent behind scorecards (effectively a national target to raise numbers adopted from care as high as possible in line with national and neighbour averages, with no cap), related to getting children already in long term care out of care and into ‘forever families’ ie. children that the courts had already decided could not safely live with their family.
What Hemming and others have expressed concern about is that – rather than being used to get children out of the care system, such ‘targets’ instead risk impacting on decision making at the stage where people are deciding if children should enter the care system i.e. when a decision is made to apply to the courts for a care order, and whether they should be adopted as opposed to some other care arrangement being chosen.
Mr Hemming has asserted for a number of years that the number of babies placed for adoption has increased and is a reflection of exactly this operation of the ‘law of unintended consequences’ i.e. councils know that babies are more ‘popular’ with adoptive parents and thus an increase in care proceedings relating to such babies will enable them to more easily meet any ‘adoption targets’ further down the line.
The statistics do support an increase in the number of babies made subject to an adoption order from 90 in 2013, to 230 in 2016. This is still only a tiny percentage of the total number of children adopted (2% and 5% respectively) but is a significant increase; more than doubling over three years. The majority of children – about 70% – are adopted between the ages of 1 and 4 years.
We are not able to draw firm conclusions from the evidence revealed by our FOI requests to say whether Mr Hemming’s fears are supported by evidence. But we are firmly of the view that this is a matter requiring further open, honest and transparent discussion. Even if there is only a perception that targets could be operating to influence decision making for children at a very early stage of proceedings, this could have a very serious impact on public trust and confidence in the system of child protection.

Pic courtesy of Jane Cockman (flickr) – thanks!
The national picture on ‘targets’
Our first report examined the facts about national government-led adoption performance management measures in England, noting that:
- English councils are performance managed against a national ‘target’ that effectively requires them to raise absolute numbers of children adopted from care as high as possible short of 100%, with no caveat or qualifier (Page 9, DfE Methodology & Guidance on Looked after children and adoption performance tables 2014)
- Councils ‘scores’ on percentage number of children adopted from care are then published with a ranking in comparison to the national average and their closest statistical neighbour averages: ‘the Children in Care and adoption Performance Tables: Scorecards for Children in Care’
This Report
This second report sets out information from our second Freedom of Information Act (FOI) request to local councils aiming to find out how things played out at local level, including whether councils were actually setting numerical targets locally for the numbers of children to be adopted from care.
The focus was on English councils, but we asked Welsh councils for completeness and comparison. (Wales has its own adoption performance management framework through the Welsh Government and Welsh National Adoption Agency. While numbers of children adopted are recorded through statutory returns, the performance management focus is only on reducing delay, having enough of the right sort of adopters recruited and adoption support – not the proportion of the care population adopted; Wales has no national target or ranking system on numbers of children adopted from care.)
The ‘snapshot’ raises a number of questions including:
- How does Ofsted assess adoption performance in respect of this statistic?
- Is target setting in local councils on this statistic common and /or increasing?
- Is use of adoption targets impacting on:
- Numbers of children being adopted from care, bearing in mind the national fall in numbers of children being adopted, and other drivers?
- Internal decisions within councils about what permanency plan an individual child requires ahead of the scrutiny of the court process?
- Public confidence?
- And, if so, how?
Our questions
We asked “with respect to adoption performance (in particular numbers of children adopted from care)” for “information and data” about:
- Individual targets, if any, set for councils by central government
- Individual responses, if any, from central government to their own adoption performance
- Direct financial benefit, if any, from numbers of children adopted
- How their particular Adoption Reform Grant (ARG) amount was determined
- The reports they had to send to the DfE to account for non-ring fenced Adoption Reform Grant spend and explain their adoption progress 2013/14
- Local adoption performance management including targets or key performance Indicators (KPIs) and how they were set and used
- Direct financial benefit to council employees from numbers of children adopted, if any.
In our letter, we linked them to 2 blog posts on our site to help them understand the context and underlying purpose of our questions, to assist them in providing more meaningful / useful answers.
The Numbers
We looked at 136 responses from 172 FOI requests. 24 responses are outstanding, including those we can’t locate; those sent to now defunct email addresses or who have replied to our old questions etc. 12 councils refused to answer or refused in respect of the key question on targets.
This report focuses only on the answers to the question about targets. We aim to write up the large amount of further information in a future post.
THE MAIN FINDINGS:
- Significant numbers of councils in England are setting local numerical targets for how many children (or what percentage of their care population) should be adopted from care
- Other councils don’t set numerical targets for numbers of children to be adopted from care
- It’s not clear from this ‘snapshot’ how many councils are target setting in this way; how the targets are set and used; or whether (let alone how) they impact on decisions about individual children
IN MORE DETAIL
(1) Evidence that some Councils in England are (or have recently been) setting targets prescribing how many children (or what percentage of their care population) should be adopted from care in a given year.
We found current (or recent) numerical target setting on the number (or percentage number) of children to be adopted from the care population in 12 replies from English councils.
Examples include those who seemed to say ‘no’ but showed documents showing otherwise:
Cheshire West
Seemed to imply not, saying: “These are set annually as follows [then listing 4 without reference to any others and including] “% of children in care adopted in the year who were placed for adoption within 12 months of the decision” [Emphasis ours here and throughout]. However they also shared documents that seem to indicate they are using targets for number of children to be adopted without any qualification of ‘within 12 months’ as well as linking this to costs savings. They sent us a document marked “REDACT 1 IES & CSC Performance Report January 2016” which said: “There have been 26 children adopted since April and we are on track to meet the target of 28 for 2015/2016”
Some replies suggest there may be other current or recent adoption targets in public documents we haven’t searched for or within corporate performance documents we are unlikely ever to see:
Lambeth
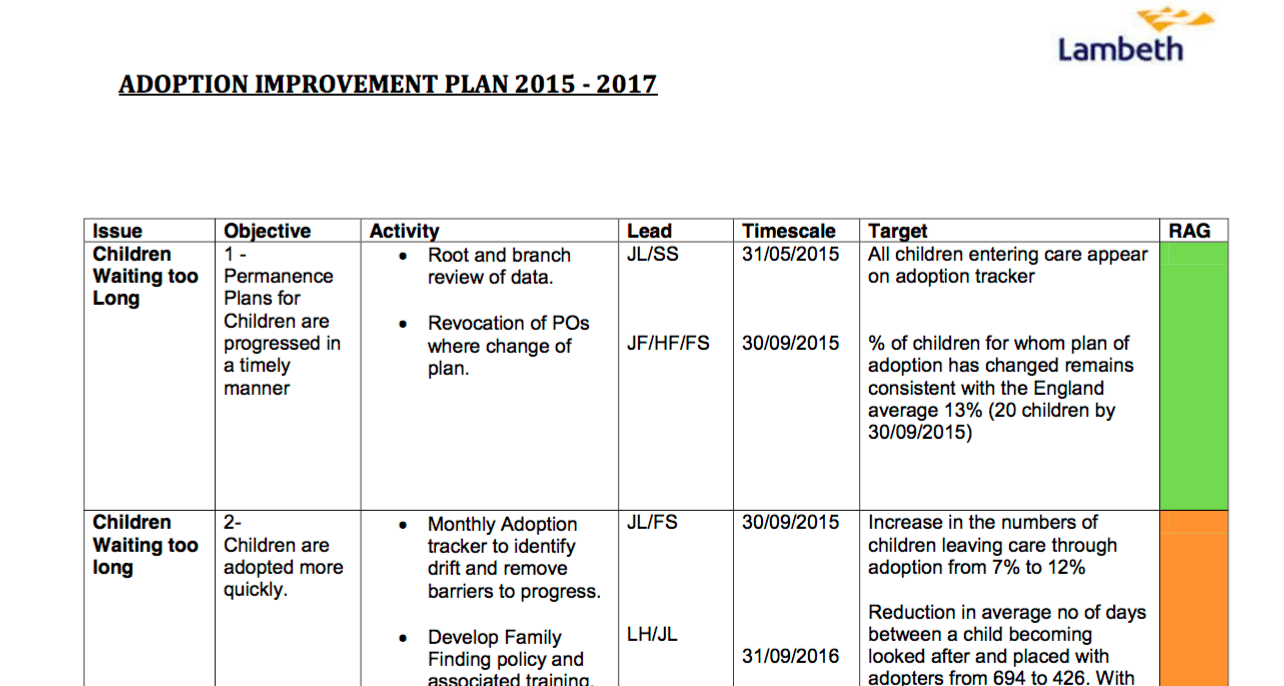 Told us that “at corporate level, performance carries a small numbers of Key Performance Indicators (KPIs) for adoption” and directed us to a public report to their cabinet called ‘Corporate Performance Digest’. We didn’t manage to find indicators there but we did notice another public document on their website they hadn’t referred to called:‘Adoption Improvement Strategy 2015’ here. The last 4 pages deal with targets. Within the heading of “Children Waiting Too Long” we found a recent target to “Increase in the numbers of children leaving care through adoption from 7% to 12%” by “30/9/15” which seemingly was not met since it was colour coded amber rather than green.
Some councils were completely open about targets:
South Gloucestershire Council
South Gloucestershire openly said that: “Performance Indicators relate to the Adoption Scorecard & targets applied by service managers in conjunction with statistical neighbour performance”. They then followed up by transparently sending a Table called ‘Social Care Indicator Summary’ they use for adoption performance management. The first indicator is ‘adopted children as a % of those who left care’. It then specifies that the ‘Target’ for 2014/15 is ‘12’ children. [Up from 9 children in 13/14].
Plymouth
YES – Said “See attachment” & shared “Dashboard” from “CYP&F Service Performance Reports” for “Feb 16” that showed a “KPI32A” “Target (RAG)” figure for “Number of Children Adopted Each Month” as “37” which wasn’t being achieved.
The following examples set us wondering whether target use might be much more widespread because what was said in the reply was completely typical of the majority of replies we received. But most councils did not send or link us to their performance monitoring reports or only sent us things that didn’t show target use. These replies are the main reason that we cannot rule out the possibility that many other English councils, who replied similarly, are not also routinely imposing numbers targets, with this possibly also on the increase.
Cambridgeshire
Told us: “Cambridgeshire CC do not have any targets or KPI’s local or regional other than the national adoption scorecard threshold detailed above.” and “There are no targets or KPIs apart from national adoption scorecard data”.
They then also sent us an old report called ‘Options Papers for ARG 2014/2015” which said: “The service has seen a significant increase in the number of children placed for adoption this year… we have placed 38 children with…adoptive families this year with 8 more due in panel….If we continue to excel [sic] the target of 40 placements additional staff will be required”
Nottingham City Council
Told us in their reply that: “the targets for adoption are those set by the Scorecard and the ALB and we work to those. Our performance is judged against these KPIs”. They also sent us links to various public record corporate parenting board documents.
But it was in the Interim Progress Report they sent to the DfE in 2014 to account for their ‘progress’ on adoption and use of non ring fenced grant monies (sent to us but not otherwise published) that we found evidence of the use of a ‘target’. Nottingham told the DfE: “Year end March 31st 2013, NCC secured 40 Adoption Orders for its children and 27 SGO’s. Year to date (1st April): 15 children have exited care with an Adoption Order. NCC has set an ambitious target of ensuring that 55 children exit care with an Adoption Order by 31st March 2014.”
Some replies indicated that the relationship between ‘targets’ and decisions about whether a particular child requires adoption is not simple:
Since 2015 we have questioned whether or not targets for number of adoptions to be achieved the following year might be set according to how many children are already subject to a plan for adoption at the point the targets were set. Though if that were the case it would seem odd that this isn’t made transparently clear – no council mentioned this in their replies to us. Indeed Haringey’s reply suggests otherwise. No council using targets caveated their target figure in that way where describing it in dashboards, reports etc. The government methodology document that guides councils on the national indicator that local targets arise in response to, certainly does not say so. It says: “Adoption Indicators: Adoption 1: Percentage of looked after children who ceased to be looked after who were adopted:… The indicator is calculated by adding all the children looked after who ceased to be looked after who were adopted “ (page 9)
Merton
John Hemming specifically referenced his assertions about target use on this statistic in relation to Merton council. See our coverage of this here : Lies damn lies and statistics. He said that they had targets to remove children from birth families both as a joint figure with Special Guardianship Orders (a type of permanent placement short of adoption, usually with extended family) and separately for adoptions. We agreed that Merton’s website showed they had a target for the percentage figure of their care population to be either adopted or made subject to an SGO but hadn’t seen any Merton document showing targets exclusively relating to adoption numbers.
Merton’s mission statement stated “We will remain committed to considering all options of permanency for all our children requiring a placement outside of their own family; this includes for those with the most complex needs, regardless of the impact on our performance scorecard”
We therefore emailed Merton in September and then October 2015 asking them to clarify how their targets were calculated but they never replied.
We were therefore particularly interested in their reply to our FOI questions. They replied to our first request sending us links to government published statistics we already had. They didn’t reply to our second request that asked in detail about targets and how they were set. When we asked them to reply or treat our email as a request for internal review they told us they never received our request. We sent a copy of the original showing it had been sent and received the following reply.
“Whilst we have a local target for adoption figures these are not broken down into individual targets for managers or social workers. We believe that by having a good understanding of our looked after child cohort and by close monitoring of care planning by senior management we have achieved a shared understanding of permanence work with a focus on achieving timely permanence outcomes for our children. This approach has been supported by the small cohorts of children that we are working with.”
They provided no explanation as to how the targets were worked out and didn’t forward any document showing any adoption targets so we don’t know what “local target for adoption figures” meant. They sent us 6 ‘Bi Annual Adoption and Permanence reports’ and told us they couldn’t send us their Quarterly reports since they contained confidential “child level trackers used in the adoption team to monitor the planning and early matching process”. There was no ‘local target for adoption figures’ in what they sent. (Neither a target for numbers of children to be adopted or made subject to SGO’s; nor even for the A1, A2 and A3 Indicators on reducing delay for children that the government prescribes a threshold for.)
Looking at the council website here we can see it remains the case that the only adoption target immediately apparent on the website is the same joint target for number of either SGO’s or adoptions, with no explanation of how that is calculated.
Sadly, we remain as unclear as we were in September 2015 on the application and significance of Merton’s adoption targets.
Some replies suggested rigorous scrutiny may be required of the assertion that targets for numbers of children to be adopted are somehow required for effective recruitment of adopters:
Haringey
“Targets for volumes of children to be placed for adoption, timescales for placement and volume are set and consequently the volume and type of adopters to be recruited is set.”
“Local targets are set by the Head of Service responsible for looked after children and adoption in conjunction with senior managers and service managers. The targets are set according to analysis of the cohort of children with an adoption plan and those likely to have an adoption plan.”
Brighton & Hove City Council
“Targets are set against two indicators (Percentage of children ceasing to be looked after who are adopted and Average time between a child entering care and moving in with its adoptive family) Targets are set by using the latest available benchmarking data (e.g. statistical neighbour data, national data or any other comparable data) or any statutory/contractual target, whichever is more challenging. Where performance is already better than benchmarking/comparable data, an improvement target in the interest of continuous improvement is set”
Manchester City Council
“ Q: What do you keep? A: Listed what they keep which included “Targets for number and % of children adopted”. Told us these are “Set by Head of Service for Looked After Children” “as part of service and sufficiency planning”
Bradford and Harrow were the other two councils who both told us directly in their replies that targets were set on this.
Some replies were unclear on local target setting, but nevertheless offered insights into how ‘early permanence’ thinking is playing out on the ground in some councils. As well as suggesting a need for more research and greater transparency about the roles of ‘Improvement Notices’, ‘diagnostic partners’ and Ofsted:
East Riding of Yorkshire
While they didn’t reply clearly as to target use: “There are no adoption indicators reported” [in the quarterly corporate reports that go SMT, Panel etc.] and “Local KPIs and targets are set by service managers”, the copy of their Grant Usage Statement to the DfE (to explain their use of the ring-fenced element of the Adoption Reform Grant) confirmed that their adoption reform strategy included:
“Three social worker and three community nursery nurses have also been employed in children’s centres from September 2013 to ensure there is an understanding of permanency planning by early intervention staff. The staff complete pre birth assessment work in the community, this targets permanency planning work with vulnerable babies and young children“.
They also forwarded their internal ‘Adoption Briefing Document’, which documented that:
“The Council had signed up to a DfE funded adoption service diagnostic assessment with Barnardo’s. The purpose of volunteering to the assessment was to examine and critically challenge the current permanence pathways for our children. This assessment took place from July 2012 to January 2013. Barnardo’s concluded that there should be a tighter focus on the work undertaken pre-entry into care. The Value for Money Business Transformation Team would be working with the Adoption Service to examine the permanency planning and case responsibility pathways.
Barnardo’s findings outlined the need to target permanency planning work with vulnerable babies and young children and the need for a greater connection between the Fostering Service and the Adoption Service. There is also a need to tighten the focus on family finding strategies.”
Kent
Told us in response to the question about targets: “this is covered by the reports which can be accessed on the link above”. That link was broken for us and we had no time to search their many publicly available documents.
However in response to our earlier question on ‘interventions’ they transparently disclosed that the government actually imposed individual targets on them to raise adoption numbers during the year 2012/2013 by way of an improvement notice.
They were the only council to disclose this to us:
“Kent was issued with an improvement notice in 2011. One of the outcomes for improvements identified was “Improving the percentage of children adopted to 11% by March 2012 and to 13% over the period 2012-13”
And:
“In July 2011, Martin Narey, the former Chief Executive of Barnardos was commissioned by the Council to carry out a review of its adoption services. This review was to establish what could be done to significantly increase the number of adoptions in the county and ways that the council, working with the family courts, and improving its own processes, could speed up and streamline the process. His report contained a number of recommendations, including one which suggested that KCC commission an independent provider specialising in adoption improvement services to manage the Council’s adoption services and deliver the suggested improvements. As a result the County Council entered into partnership contract with Coram, a highly regarded children’s charity with an established and successful track record. As well as working successfully in Kent, Coram has been successful in working under the sponsorship of the DfE and in partnership with other local authorities eg. Harrow and Cambridgeshire. The improvement journey of the partnership has been fast and very successful to date. Between 1 April 2013 and 31 March 2014 145 children were adopted in Kent County Council, which is significantly higher (38.1%) than the number of children adopted in 2012/13 (105) and over double (107.1%) the number of adoptions achieved in 2011/12 (70). In addition to this, a summer 2014 follow up review of the service by Jonathan Pearce who had led the Independent Improvement Board for Ofsted found that adoption in Kent now has considerable strengths. [See here for information from Coram about the Coram-Kent adoption partnership]
Some councils told us that Ofsted inspects on the basis of this statistic:
Wandsworth
“In addition to KPIs re the Adoption Scorecards [our] adoption performance is scrutinised by Ofsted in relation to how we compare with our statistical neighbours, London authorities, and adoption agencies nationally re the numbers of children with adoption decision and those placed for adoption”.
Northamptonshire
Told us “Northamptonshire County Council’s direction to improve notice (Nov 13) included adoption and directed the Local Authority to engage an improvement partner for adoption”.
Wales
By contrast we didn’t find any examples of Welsh councils using numerical targets on this statistic. (Whilst we don’t think the national performance management context for Wales makes target use likely in the way the English context seems to, our ‘snapshot’ evidence does not show whether or not Welsh councils ever use targets.)
(2) Evidence that other councils firmly reject use of local targets for numbers of children to be adopted
We also found evidence that numerical targets were not being used at local level in 17 English councils, either through replies or relevant reports linked or sent.
Leeds
“Children’s services follow the principles of outcomes based accountability. At partnership and city levels we focus on the movement of lead indicators and place this in context, comparing to others and in terms of local developments. At service level we ask how much has been done, how well and is anyone better off. The culture is restorative so performance management is done with people, not to, with the emphasis being on understanding, learning and acting on the intelligence. In this context while fully aware of the data it is not a practice to set targets, it is about using information to improve practice and outcomes”.
And unusually, in the case of North Somerset, a precise on-point reply, backed up with the key relevant document:
North Somerset
“We don’t set local targets and we follow national KPIs”. “Please refer to the attached document “Adoption Performance Charts”” (which confirmed this).
One authority told us there was a national view of “10%” being a reasonable guide which we had never heard of. Again this accentuates the very grey area between ‘benchmarking’ and ‘targets’ in the current national context in England of published numerical comparison with neighbours and the national average. The bigger leap is perhaps from the Welsh Government approach to performance management to the English Department for Education approach, rather than whether some individual councils actually use a target figure for children to be adopted from care or refer to the existing target figure already effectively set for them by the ‘crabs in a bucket’ race to stay ahead of the neighbours and up with the national average.
Bath & NE Somerset
“We have no fixed formal targets set (as we are a very small local authority and numbers vary). Furthermore, the recent practice in Court around adoption and case law has had significant impact. We do consider the national view of 10% of young people leaving care being adopted as a reasonable guide.”
Some councils seemed perfectly confident they could both make complex predictions of need based on statistics for children and not resort to setting targets:
Staffordshire
“Local Key Performance Indicators are set in conjunction with the service manager. We do not set targets but use the national threshold as a baseline. The Performance team prepare the reports for ALB [Adoption Leadership Board] and for regional benchmarking.”
Surrey
“We do not have a target set for numbers of adoptions from care, but use departmental data on children with current adoption plans to help predict number of adoptive placements needed and this informs our recruitment strategy”
Some councils who were not using targets explained a [then] rise in numbers of children being adopted in their council as resulting directly from measures to improve recruitment of adopters, reduce delay and support adoption, at least in 2013/2014:
NE Lincolnshire
Explained within their (unpublished) Grant Usage Statement to the DfE in 2014 that: “The impact [of progress on targets to speed up etc but not on numbers to be adopted] has been evidenced by the numbers of children adopted April 2013 – March 2014: 30 which is 57% increase on the year before…”
The others councils who plainly told or showed us they did not set targets on this statistic were Barnsley, Brent, Bromley, Cheshire West, Ealing, Milton Keynes, Newham, Poole, Rutland, Swindon and Wolverhampton.
Even in the majority group we categorised as uncertain there were those who seemed more likely to be using targets than others. Some councils shared documents indicative of a highly child needs led approach to permanency planning, even where they didn’t answer specifically on target use on numbers:
Lincolnshire County Council
Told the DfE in 2014: “ARG also used to establish ‘Exit Team’: “The aim of the project is to contribute to the achievement of LAC’s care plans for permanency using a child focused approach which takes into account Children and Young People’s identity and cultural considerations. The remit of the team is to increase the achievement of permanent care options for those Looked After Children without an Adoption plan or for whom an Adoption plan has not been achieved and to reunify children with their birth families where it is safe and appropriate to do so…where appropriate, children have been identified for some additional social work intervention/ assessment/ report, for an exit from care/ permanency plan to be facilitated through a range of options such as:
- Return to birth parent from looked after placement
- Discharge of Care Order for those LAC’s Placed with Parents
- Discharge to family and friends carers under Residence Order, SGO or Adoption
- Discharge of a Placement Order and conversion of a task centred foster placement to a permanent fostering placement
- Conversion of a fostering placement to an SGO or adoption placement
We have seen permanency plans come to fruition, revocations of care orders, permanent matches with the child’s current foster carer, adoption applications by foster carers and foster carer applications for an SGO…our commitment that where the circumstances of the child required, that the priority would be given to ensuring the best outcome for the child, over adherence to timescales.“
(3) Inadequate evidence to conclude even roughly how many councils are (or are not) using targets for numbers of children adopted; nor how they are being set and used; nor whether (let alone how) they may inappropriately impact on decisions about individual children
With a few notable exceptions, we could not determine whether English councils were or were not using targets on this statistic somewhere within their council.
Neither the replies of most English councils nor the disclosure of relevant performance reports of most English councils, when taken in the context of national performance expectations, were sufficiently clear for us to reach a conclusion.
We may have missed some or even many councils using targets and some or even many who were not using targets. We have simply aimed to produce a snapshot, not any kind of quantitative analysis.
The following factors may have influenced the gaps in the information:
Our questions
There was some initial lack of clarity in our questions. Inevitably by the end of the exercise we have a greater understanding of what would have been better and simpler questions to pin this down.
Some councils may have been trying to say “no we don’t have a target other than benchmarking ourselves against the national average and statistical neighbour average” when replying “N/A” or “No targets or KPIs beyond statutory returns” or “ nothing beyond adoption scorecard indicators” etc to our question about what local performance management measures they used including KPIs or targets.
The exact question we asked was “with respect to adoption performance (in particular numbers of children adopted from care), what performance management tools or systems does your authority operate and in particular what key performance indicators, targets, or similar does your authority apply (or has your authority applied in the last 3 years). Please provide copies for the last three full statistical years and year to date or links if published.” (A previous question had asked them to list what performance records they kept ‘ beyond statutory returns’.) But in light of the reply of Cambridgeshire and others (see page 4 above) we simply could not make that assumption.
Yet notably, all councils found it easy to be decisive in saying ‘no this has never happened’ or equivalent on the final question about whether or not any staff ever get performance related pay or equivalent based on numbers of children placed for adoption/adopted.
And a few were equally clear in saying that targets were not considered in staff appraisals.
We couldn’t help but wonder if some replies indicated a reluctance to answer frankly and specifically on targets or to transparently disclose the relevant performance management reports. It was very rare to get a straight answer to using a ‘target’ on that statistic let alone have the relevant performance management document identified and forwarded too.
Language
Language was an issue. While it’s the Children In Care Performance Scorecards that actually rank councils including on the ‘Indicator’ of percentage number of children adopted from care, the ‘Adoption Scorecards’ also feature this allowing councils to compare themselves to the national average and statistical neighbours. We were never entirely sure when councils were referring to each.
When the Government says ‘Thresholds’ they mean ‘Targets’ and where they say ‘Indicators’ they may not. In the case of this ‘Indicator’ on percentage adoptions from care there is no ‘Threshold’ or ‘Target’ as such. Just the government expectation that councils raise adoption numbers (short of 100%) in line with national and statistical neighbour averages and be ranked and measured against this including to some degree within the new single Ofsted Inspection framework. (See page 3 above for links to the adoption scorecards and our Part One report on the national picture). So we were not always sure what councils thought we meant by ‘targets’ let alone what they meant by them. Councils often didn’t clearly distinguish ‘Indicators’ / ‘Key Performance Indicators’ from ‘Targets’ or ‘Thresholds’, let alone ‘Benchmarks’.
They used imprecise terminology such as ‘we only performance manage on the scorecard indicators’ or spoke of ‘benchmarking’ [locally, nationally and now regionally].
Other factors:
- Often we were linked to, or sent, so many reports without them being narrowed down for us, that we were simply unable to wade through them, given that the work was unpaid and how long the enquiry had already taken.
- In some cases, we couldn’t open PDF attachments or links, or were linked to such a general array of scrutiny documents (agendas, background reports and minutes) that again we simply didn’t have the time to pinpoint the right document if it was there.
- We also missed some councils out altogether, only realizing that the request had gone to a changed mail box etc. when analysing the results. Sometimes a council had replied wrongly to our original questions and we didn’t always have time to chase this up. Some councils refused the request or the targets part of it.
- There were discrepancies between what some councils said in their reply to us and what documents attached said.
- There is a wide range of reports and names for them at service level and management and corporate level.
The ‘snapshot’ raises a number of questions including:
- How does Ofsted assess adoption performance in respect of this statistic?
- Is target setting in local councils on this statistic common and /or increasing?
- Is use of adoption targets impacting on:
- Numbers of children being adopted from care, bearing in mind the national fall in numbers and other drivers (such as court appeals, changes in fertility treatment, the end of ‘heritage’ cases and costs drivers on councils, with rises in special guardianship orders)
- Internal decisions within Councils about what permanency plan an individual child requires ahead of the scrutiny of the court process?
- Public confidence; the trust a family can have when entering the child protection process; and the apparent continuing rise of alarming and unhelpful messages to families. These are along the lines of: ‘social workers want your child for the adoption market or to hit their target and get their bonus – flee the jurisdiction; stop working with social workers; and /or to routinely appeal adoption decisions (with impact for individual children and public resources).
- And if so how?
When thinking about public confidence in the child protection process and in child social work generally, perceptions about the extent and purpose of adoption targets and a lack of clarity and transparency about these issues are likely to be as important as the reality.
Conclusion
It is not the role of The Transparency Project to comment on matters of public policy, such as whether or not adoption is the required outcome for children currently in the care system. However, The Transparency Project is concerned that this exercise has revealed significant difficulties in getting hold of relevant information. The information we have received indicates that some people would be – at the very least – alarmed by what they perceive as ‘target driven’ decision making.
There are many who assert that it is unhelpful, unfair (and unrealistic too) for children and families, councils and the family justice system for councils to be performance managed on the basis of a target for numbers of children adopted from care.
John Hemming has for many years now claimed that ‘targets’ to get children out of care and into adoptive homes may be seen as well intentioned plans to provide children with safe and permanent homes, which few would disagree is in a child’s best interests.
But his point is that in practice these ‘targets’ begin to ‘bite’ much earlier and that ‘adoptable’ children are targeted at a very early stage and thus care proceedings will be initiated in order to take the children who would be easily adoptable and thus enable councils to stay on ‘target’.
We agree that there is certainly a risk that ‘targets’ on this statistic could come to drive or contaminate decision making which becomes divorced from the needs of the individual child. Even if this is not happening in practice, it is still important that families are not given the impression that it could be happening. The perception is as harmful as the reality.
APPENDIX
Background Transparency Project blog posts on this topic with links
A lie can get round the world before the truth has put its boots on
Sarah P (23/07/15)
The continuing myth that the UK is the ‘only’ country that permits ‘forced adoption’. (touches on historic adoption targets up to 2008)
http://www.transparencyproject.org.uk/a-lie-can-get-round-the-world-before-the-truth-has-put-its-boots-on/
Lies, damn lies and statistics
(24/09/15)
Is the drive to get children out of state care and into adoptive families having an impact on decision making in care proceedings? This is a collective post by the Transparency Project…
http://www.transparencyproject.org.uk/lies-damn-lies-and-statistics/
Update on ‘Adoption Targets’
Alice T (Oct 9 2015)
The continuing quest to get to the bottom of performance measurement and target setting about adoption at national, regional and local level.
We have definitely not yet reached the bottom! (Whatever is or is not down there)
This is an update to Lies, damn lies and statistics:Is the drive to get children out of state care and into adoptive families having an impact on decision making in care proceedings? published on 24 September. (Itself an update to a series of other posts).
http://www.transparencyproject.org.uk/update-on-adoption-targets/
It’s wrong to measure the success of local authorities in terms of adoption numbers
Alice T (23 Nov 2015)
Is the government drive to increase the numbers of children adopted from care (as opposed to the speed of decision making and the journey time to an adoptive placement once decision made), wrongly affecting individual placement choice for children? (Part One)
http://www.transparencyproject.org.uk/its-wrong-to-measure-the-success-of-local-authorities-in-terms-of-adoption-numbers/
Adoption – where are we now?
Julie D Apr 16, 2016
On the publication of the government paper on adoption
http://www.transparencyproject.org.uk/adoption-where-are-we-now/
Adoption – rhetoric and facts (again)
Julie D May 22, 2016
Last Sunday, the Prime Minister was widely quoted from the Sunday Times as being ‘unashamedly pro-adoption’ in describing the new Children and Social Work Bill announced later last week in the Queen’s Speech.
http://www.transparencyproject.org.uk/adoption-rhetoric-and-facts-again/
Adopting more children from care will save £310m, says government – or does it?
Lucy R (19 Jun 16)
http://www.transparencyproject.org.uk/adopting-more-children-from-care-will-save-310m-says-government-or-does-it/
Update on Freedom of Information responses about adoption ‘targets’
Alice T Jul 17, 2016
http://www.transparencyproject.org.uk/update-on-freedom-of-information-responses-about-adoption-targets/
[Update : We neglected to attach our press release on this post, which you can find here]
[Update :
Some responses to this post :
John Hemming’s guest post on this blog
Community care : Councils setting numerical targets for adoption
ADCS Press Release and our response to it.
My child was nearly adopted – here’s why adoption targets are wrong by @survivecourt on Community Care.]
Well done with this. I have done a blog post in response.
http://johnhemming.blogspot.co.uk/2016/11/the-transparency-project-and-adoption.html
How can I get in touch with someone who made this article asap?? I need urgent help and advice please
Hello Mariana, We can be contacted on info@transparencyproject.org.uk – but we can’t help with individual cases I’m afraid. Lucy
Lucy, do you think this could be used as new evidence when opposing adoption?
Nope. I don’t. Sorry.
Do you think the court, when presented with a care plan for adoption, should ask the local authority about its use of targets?
So disgusting all that. “Targets”for human life. Together with “future emotional harm” make trademark of child protection, isn,t it?
Please read our post carefully Eugene – it’s not straightforward.
In my experience first time parents with learning disability appear to be considered as easy targets to remove their babies from birth with the plan being for adoption.
I would be interested to know if the adoption figures reflect this
Teresa,
That is a very interesting point as there are certainly occasions where a leap is made from LD to inability to manage – and of course many parents with LDs can manage with help and support – but I don’t think those stats are kept. I suppose the only stats that might help are any figures for how many parents are under the official solicitor (which of course is not all parents with LDs). But I doubt that one can match those with outcomes in individual cases to see if the proportions are different. And I suppose, to the extent that some parents with LDs can’t manage the care of a child adequately (some can) we might expect the proportion of children removed to be legitimately higher to an extent? Maybe… I think it would need a qualitative study and I’m not aware of one being done.
Lucy
There is some ongoing research, see
http://www.nuffieldfoundation.org/getting-it-right-time-parents-who-lack-litigation-capacity-public-law
In 2010 my Son was adopted without consent for ‘risk of future emotional harm’, I spent 7 months in a placement with him, which was initially supposed to be 12 weeks. The date for me leaving just kept being extended. I saw 2 psychologists who were Doctors, who both had employment outside of the LA, who gave me good reports, and an independent SW who was the manager of the team I was assessed by between 1997 and 1999 (A team on this list by the way). She stated I should go home with my Son immediately and could see no reason for it to be a staged return. My own Mother died whilst I was in placement, and I was then sent to see a third, lesser qualified psychologist, who has no other employment than that provided by the LA . Then came ‘Death by psychometric’ and she used me grieving for my own Mother as a reason I couldn’t parent my Son. The now HCPC impaired SW refused a change of placement when I asked for one, even though the foster carer stated she didn’t want me in her house, and she gave me no reason why I couldn’t change placement, regardless of the fact the FC was making it difficult for me only a matter of weeks after my Mum’s death.
So, I appreciate what you are saying about the judge making the final decision, but there are ways of wording things to make mountains out of everybody else’ molehills, and having a dutch auction of experts, until one gives you something you can run with. Where there are targets, there are incentives to do the aforementioned. Even if that is against the advice of a woman who used to manage child protection unit in your area.
Anyway, I have requested face to face contact with my Son, many times, and I have been refused. I have kept all of my original paperwork to show my Son, and the covert recordings of meetings etc, just so he knows that I genuinely did him no harm. He doesn’t even need to hear ‘my side’, he has his paperwork and recordings to inform his opinion. I have also kept my contact refusals.
I would love to know how the adoptive parents are going to answer my Son when he asks why he was adopted, or how they will answer why they have refused contact. Or even how anybody makes him understand why his Grandmother dying meant he ‘couldn’t’ be parented by his own Mother who took great care of him.
Please post this I think that this is highly relevant to the article, and also highly relevant to any adoptive parent who is raising a child that was adopted for ‘risk of future emotional harm’. The reality of the situation is that there will come a point when children learn why they were adopted, and some will as Dr. Peter Dale says ‘vote with their feet’, surely it makes sense to promote face to face contact maybe 4 times a year, and find ways to have natural and adoptive parents form a civil working relationship with each other? It would prevent some children from forming a disney like ideal of what their natural families are like in their heads, and seeing the natural parents on speaking terms with the adopters can only be a good thing surely? Now what with me being in natural parent support groups, I see plenty of people who are going to ‘give the truth’ to their children, and I don’t mean that they are saying that in a supportive way, but these are people, who like myself, will have been denied contact many times, and the anger over that is stewing. Therefore is it fair of adopters, in a case like mine (no abuse, no neglect) to expect that they can refuse contact time and time again, but that natural parents are to be expected to work with them in the future should the child ‘vote with its feet’?
Expect No Help whatsoever from the LA for contact information or help when your child reaches the age of 18yrs, just keep track as best you can as we have done over the 19yrs of my adopted grandchild, even now Redcar & Cleveland Social Services Department for after adoption information is closed for any help in contact, an after adoption agency as advised we contact him personally as we know his whereabouts, the written truth we hold from the day he was born, photographs, video. QC Fockes court file makes terrible reading
My family live in Dorset and have been through this.
Hi, I’ve edited your name for legal reasons. Annie
“she used me grieving for my own Mother as a reason I couldn’t parent my Son”.
this so-called psycho’ should be struck off. these are the very people aiding and abetting the rotten child stealing industry via the almost asleep family court judges.
“no punishment without crime” should be the foundation in all family courts. that means if you have not harmed your children then the LA should not be allowed to remove them. the Govt are to directly to blame for
My comment above was in reply to CA.
at the bottom a meant to say the Govt are directly to blame for this frankenstein monster that is the Adoption and Fostering industry.
the sooner everyone wakes up to the fact that its generating multi millions of pounds and a very cushy lifestyle for those within the racket, the sooner action can be taken to combat corruption within it.
Taking into consideration many years ago Redcar & Cleveland LA had to admit to false sexual abuse claims, it would have been interesting to know their numbers
Redcar’s response was ambiguous : “nothing is produced beyond statutory requirements and scorecard indicators”.
Oh, and I should have said – we weren’t collecting data on the numbers of adoptions, only on whether targets were in use or not.
Interestingly the French Family Lawyers association thought what I had to say was so significant that they invited me to speak at their annual conference in Paris (Versailles). They saw nothing wrong with the idea that expert evidence should be independent.
I would happily write a blog post for the transparency project about the importance of the SSDA903 return statistics and their meaning as to whether the courts are adding value to the child protection system system or not really that much.
Nobody sees anything wrong with the idea that expert evidence should be independent. Expert evidence is independent. That’s why the court asks for it. I don’t understand this comment.
As I used to say on your site Sara , “No conspiracy necessary” ! When many of our wonderful MPs decided to fiddle their expenses nobody suggests 650 of them got together in Westminster to work out how to do it ! No each greedy member who fiddled worked out his/her own dodge be it duck houses ,moats,or secretary/mistresses !
In family courts birds of a Feather DO flock together not to conspire,but each to Feather its own nest ! Add to that the reluctance of social workers and “experts” to admit their mistakes so that “cover up ” is the order of the day with snouts in the trough for the Foster and adoption agencies making millions out of the misery of others.Who needs conspiracies when it is so easy for the wicked to prosper?
Yes ‘used to say’ on my site. Mr Josephs can no longer comment on my site as I had to ban him for persistent breach of the court reporting order relating to the Marie Black case. Marie Black is of course the convicted paedophile to whom Mr Josephs gave money to enable her to leave the country when facing care proceedings. He confirmed that he did not carry out any investigation into her background to reassure himself that this would be a safe course of action for her child.
Some may find that these actions of Mr Josephs impact on the credibility that they give his arguments. I certainly wish that the French documentary makers had been a little more assiduous in their research on the background of those encouraging them to produce this nonsense.
After only an initial read through, I wish to say that I think this is an extremely important project raising crucial questions that do need answers, so that the fears of those who wrote statements such as ‘fostering and adoption industry’ can be allayed and so that genuine queries about whether a greater proportion of younger children are taken down the adoption route without sufficient interventions by Children’s Services of a supportive kind being made are addressed. Only then will adoption as ONE of the options for permanency for children recover its status or image in the eyes of the public – birth families, prospective and actual adoptive families and professionals alike. I have worked in the fields of child support, child protection and adoption for many years between 1989 and the recent past. The respective Governments of Labour and the Conservatives need to look at the impact of their actions on local authorities.
Thanks Sally.
I agree with every word of this. Discussion about these issues has been toxic for far too long. Against the dangerous conspiracy theories of Ian Josephs and John Hemming, the Government has offered only tone deaf propagandising that ‘adoption is best’. If we do not try and find out actual facts and then debate those facts, the situation can only get worse.
It shouldn’t have taken so long or be so difficult to find out this information, perception is important, and there should be more transparency.
We all know about score cards and what they do. I have never seen targets (having worked across most LAs in the country in one role) but I have seen forecasting for known children. This is also how adopters are recruited.
The notion of procuring children to meet targets is alarmist and would be eugenics, this fits with this & Blair’s government rhetoric. (That rhetoric also says that the new Children and Social Work Bill will address adoption numbers, I have yet to work out how on earth it does this?). I think the government of whatever ilk should be much more mindful of the narrative this creates, and where it leads, but fear they reverted some time ago to the idea of the deserving and undeserving so beloved of Victorian philanthropists.
I hope you achieve clarity sooner than the year this took and the coverage might get the answers rather than this being a notion that remains in the minds of scared parents even if the outcome is reassuring.
I am french. I had my daughter taken away by English courts. I fought till the adoption order was pronounced. Of course. Being pregnant I had my son back in France… I knew exactly that I wouldn’t stand a chance of leaving the hospital with him. Risk of emotional harm. Otherwise said… mickey mouse excuse… I was an engineering officer in the British Merchant Navy. I was also a lecturer in marine electrotechnical engineering. I was also a very loving and dedicated mother to my daughter. To the question ‘do the courts really help?’ I have an experienced answer for you : kangaroo courts…
As for the overall topic of whether a child should be taken into care and adopted out (within a 26 week short timeframe) the best answer that will satisfy the parents who have lost their children to the system and those who are soooo sceptical that these horrible things take place behind the closed doors of court and social services premises…. OPEN THE FAMILY COURT TO PUBLIC SCRUTINY!!!
It’s awful what things happen my daughter s son was adopted she loves that baby , she was in care when younger , it was her first baby
I think this raises a lot more questions then it does answers as an aside KPIs are targets and used as such by every public sector dept and each dept is measured against them
Did you ever receive a response from Sunderland city council on Adoption targets ?
Also were your requests Foi requests ?
They were FOI requests. I would have to check the position on Sunderland.
did you ever get a response ?
if not are you able to complain to the Information Commissioner’s Office.
Also could you send them a request for the stats on forced Adoption and how many children over the past 10 yrs or 5 yrs were the subject of this.
We don’t plan to carry out any further work on this project, for resource reasons.
Thats very disappointing to hear.
sends out the wrong message to LAs who will now think they can just ignore all FOi requests because they know nobody will follow up on it and badger them for the truth.
I don’t think so. We have done extensive work and chasing on this project and we had to draw a line somewhere. We have to focus on other projects now. But others are making and enforcing FOI requests all the time, to very good effect.
If they opened the Family Courts there would be up roar – I’m a Social Worker and literally have to fight some of my own LA ‘s when it comes to some care order cases and adoptions .So many obstacles put in the way of young parents, who with support could look after their child . Opening the Family Court would make public furious and make LA’s accountable for the things they haven’t done to keep that child at home ! I’ve found Wales are particularly pro adoption, Solicitors dismissive of the SW Plans for reunification and yes I’m suspicious. Seems they target very young or people with history of Social Care involvement. Likewise people who need additional support due to disabilities , learning or physical. I have used a lot of energy supporting families to ensure the child is kept within his/her own family or fought for open adoption angering a manager so much I was asked to leave for finding a the father name back in 2008 and hence upsetting this managements adoption plan ? Something definitely smells in Denmark and as a SW I am in full support of Family Courts being much more transparent and open to challenges and investigations.
I don’t know why there isn’t an accessible independent body somewhere over seeing that the cases been fair . I’ve met some excellent family court advisors and some that are diabolical, spend no time with the children they are meant to be representing. I’ve also been there at the other end – adoption break downs and YP with mental health problems from a life never knowing their own family not to mention the aftermath to parents of a removed child – nearly 30 yrs in SW and not once have I seen support or therapeutic services put in place for parents whose child has been adopted. It’s a can of worms that needs exposure .
Ofsted released a report in 2015 , stating surrey council were/ are failing children especially those with special needs . the only target that surrey managed to reach was adoption and every other of the targets were deemed inadequate
I have read so many articles on the topic of the blogger lovers however this piece of writing is actually a good
paragraph, keep it up.
It happened; look at the LA stats. Add Somerset to that, the Devolvement of CS, RAAs, the drive to cut the cost per child to 7. 5 k (;the ASF being the flying pig for redacting the model means test) etc etc. I think the select committee might suspect.